I got good results using an RNN for a text categorization task. Then I tried using a 1D CNN for the same task. To my surprise, I got even better results, and the model was two magnitudes smaller. How can such a lightweight model perform so well?
Out of curiosity, and also to verify the results, I wanted to visualize what the neural network was learning. This being one-dimensional text data the convolution filter visualizations were not interesting. For image data, check out Understanding Neural Networks Through Deep Visualization.
I turned to occlusion, as described in Matthew Zeiler’s paper. To find out what a neural network is recognizing we occlude parts of the input to the network. When the model’s output deviates, the occluded part is significant to the prediction. I haven’t seen occlusion used for text data but decided to give it a go.
Test case: categorize sports team names by age. For example:
 "Westend Old Boys" -> "adult";
 "Indians G Juniors" -> "children";
 "SV Alexanderplatz U7" -> "children";
 "Karlsruhe Erste Männer" -> "adult";
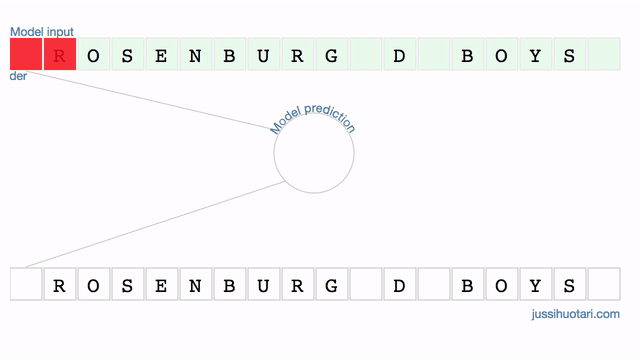
The model outputs the probability of a junior team. In Finland, D-boys are typically 13-14 years old. When the occluder slides over the characters that signify the age group, i.e. “_D_”, the probability drops drastically. On the other hand, occluding parts of the town name “Rosenburg” makes very little difference. It seems that the model is truly identifying the relevant region in the input data.
Great example! as a curiosity of myself, how did you make the animation?
Thanks!
Nicola
Thanks, Nicola. Great to hear you like it. 🙂 I built the animation with html, css, and the awesome https://d3js.org/ .
Seems like I’ve archived the source code somewhere safe, as I couldn’t find it on a quick look.